Shopify’s (SHOP-NYSE) share price continues to fluctuate as questions about future gross margins, churn, and valuation continue. We take a unique approach to Shopify’s subscription valuation in order to account for its Merchant business that accounted for 36% of gross margin dollars (TTM).
What Moves SHOP’s Share Price and how has it Traded?
Source: Perspectec
Shopify’s gross margin profile, subscription churn (based on our survey) and operating expense put Shopify as a very expensive stock relative to its peer group.
Getting a Clean Shopify SaaS Valuation
We believe Shopify’s valuation should be based on its relative SaaS valuation. We do not see a path to a sustainable EPS or EBITDA that would value SHOP anywhere close to its current share price.
Typically the best metric is to use a Customer Lifetime Value metric (TTM gross margin) divided by Customer Growth Costs (CGC) to come to a multiple that could imply a reasonable EV/EBITDA multiple. However, we estimate Shopify’s EBITDA to only be $38 million in 2018. Compared to its Enterprise Value of over $10 billion, EBITDA does not appear to be a realistic valuation metric.
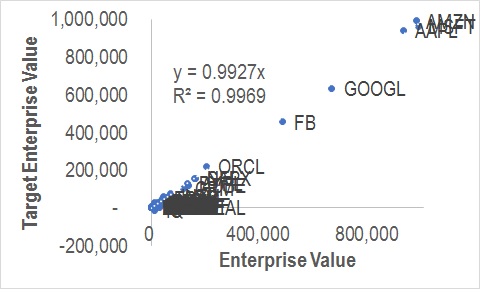
Below is the regression testing results using Shopify, Wix, GoDaddy, ZenDesk, Box, Hubspot, Salesforce, and RingCentral.
Regression Tests Show A Good Relationship between CLTV and CLTV/CGC Added and Predicting the Market Capitalization of a Company
Source: Perspectec
We found a good Relationship using CLTV TTM (Proxy for the size of the Customer Base) and CLTV/CGC added TTM (Proxy for how easily a company grew taking into account profitability). Despite the lower adjusted r-square, we believe using ‘CLTV/CGC added’ is a factor is necessary to account for the profitable growth of a company.
For companies with non-subscription gross margin streams, we take these revenue streams as a reduction in CGC. In Shopify’s case, the gross margin dollars from its Merchant Solutions business the last 12 months ($150 million) can be seen as mostly paying for Shopify’s R&D costs ($157 million TTM costs). This increases Shopify’s CLTV/CGC from 0.5x to 0.9x.
Applying our 1x TTM CLTV ($1,971 billion)+ 4,500 TTM CLTV added (0.93) gets us to a dilutive market cap (using 105 million shares outstanding) of about $6,100 billion or $53 per share (shop trades around $150 today).
Merchant Gross Margins Matter Less
An argument can be made that the value of Shopify’s subscriber business is that it is a gig economy solution, with a potential market opportunity being the underemployed and unemployed. Rather than valuing the company on a relative e-commerce subscription business that in the future drives to 2% free cash flow yields, some investors believe a larger company will look to acquire an established business to grow its e-commerce solution acquirer. This appears to be playing out in the company’s valuation, as investors appear to be looking more at the value of Shopify’s customer base and less at profitability.
As a result of how we believe investors are valuing Shopify, we value the company on its customer lifetime value statistics.
GIven the size of SHOP’s S&M and R&D costs (TTM $360 million) in comparison to SHOP’s Merchant gross margins (TTM $150 million) and GAAP EBIT margins (TTM -10.1%), we believe the best way to value Shopify is to reduce the company’s expenses by Merchant gross margin. This way we can compare Shopify on an Apples-to-apples basis.
Shopify Shipping, Capital and Referral Fees Don’t Really Matter
Shopify continues to emphasize the importance of revenue and margin growth from Shopify Shipping and Shopify Capital. Citron’s Andrew Left, who criticizes Shopify’s affiliate marketing program (Shopify recognizes this as referral fees) as pushing people to promote a get rich scheme, has shorted the stock largely as a result of a lack of visibility here. Our take is that this is not a very material part of Shopify’s pipeline for Customer Lifetime Value.
We have forecasted the breakdown of merchant revenue, including Shopify Payments, Transaction fees, referral fees, Shopify Shipping and Shopify Capital. Our view is that Shopify Shipping, Capital and referral fees will never come close to surpassing Shopify Payments in terms of total revenue. The positive increases in gross margin % we believe will be somewhat material (gross margin dollars might equal subscription by 2022).
Shopify has more credibility here when it comes to their merchant solutions business. Below we attempt to break out the revenue and gross margins of Shopify’s merchant business. Shopify has not consistently released these figures.
Perspectec’s Estimate for Merchant Revenue
Source: Perspectec
As mentioned earlier, we see Merchant solutions acting as a subsidy to Shopify’s subscription business and the movements of these sub-businesses are not material enough to CLTV to make more than a passing mention of it.
Perspectec’s Estimate for Merchant Gross Margin
Source: Perspectec
Valuation on a DCF basis
Current prices imply a 2022 Free Cash Flow (FCF) of $356 million (based on our estimates), a figure unlikely attainable by SHOP at this rate. Current 2022 FCF yields are at 0.44% as well, below usual growth stock 5-year FCFs of around 1-2%.
The current stock price assumes a terminal growth rate of about 9% assuming a 9.28% WACC
Source: Perspectec
Summary of DCF Assumptions
Source: Perspectec
10% Revenue Beats and Large EBIT Beats Versus Guidance Are Required For SHOP’s Share Price not to Drop on Quarterly Results
Shopify consistently sandbags revenue and adjusted EBIT. In 2015 larger than expected revenue beats moved the stock higher. Today greater than expected adjusted EBIT beats is the metric that primarily moves the stock.
However the beats necessary to move the stock higher have moved significantly higher. For instance last quarter (fiscal Q1/18 quarter ending March 31, 2018) despite a 7% revenue beat and 97% adjusted EBIT guidance beat (-$0.2 million reported versus -$7 million guidance), the stock still moved 1% lower in the days surrounding the release.
Our calculations on price changes include the price change the day prior to reported earnings and the two trading days after.
Important Disclosures and Disclaimer
This publication is produced by Perspectec Inc. This publication and the contents hereof are intended for information purposes only, and may be subject to change without further notice. Any use, disclosure,
distribution, dissemination, copying, printing or reliance on this publication for any other purpose without our prior consent or approval is strictly prohibited. Neither Perspectec Inc. nor any of its respective parent, holding, subsidiaries or affiliates, nor any of its respective directors, officers, independent contractors, servants and employees, represent nor warrant the accuracy or completeness of the information contained herein or as to the existence of other facts which might be significant, and will not accept any responsibility or liability whatsoever for any use of or reliance upon this publication or any of the contents hereof.
No publications, nor any content hereof, constitute, or are to be construed as, an offer or solicitation of an offer to buy or sell any of the securities or investments.
This research report is not to be relied upon by any person in making any investment decision or otherwise advising with respect to, or dealing in, the securities mentioned, as it does not take into account the specific investment objectives, financial situation and particular needs of any person. Please refer to Persepctec Inc.’s terms of use disclosure and privacy policy https://perspectec.com/term_of_use
|
RATING |
CURRENT RATING |
PREVIOUS RATING |
|
BUY |
|
|
|
HOLD/NEUTRAL |
|
|
|
SELL |
✔ |
|
For the purposes of complying with NYSE, NASDAQ and all Self-Regulatory Organizations, Perspectec Inc. has assigned the following rating system BUY, HOLD/NEUTRAL, SELL for the securities which are the views expressed by an analyst, Independent contractor, and or an employee of Perspectec Inc. The information and opinions in these reports were prepared by Perspectec Inc. or an analyst, independent contractor. Though the information herein is believed to be reliable and has been obtained from public sources believed to be reliable. Perspectec Inc. makes no representation as to its accuracy or completeness.