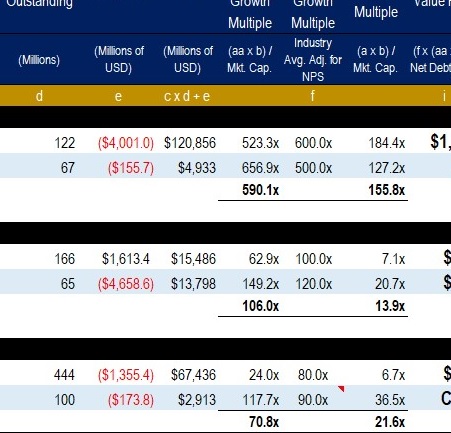
We have made our Excel Shopify Financial Model available to for Institutional Equity Research Subscribers. What this file includes:
- Quarterly historical and forecasted (up to Q4/23) drivers of revenue and gross margin for Shopify POS, Domain Names, one-time App revenue, one-time Theme revenue, recurring App revenue, Shopify Plus, non-Plus subscriptions, Shopify Payments, transaction fees, partner referral fees, Shopify Shipping, Shopify Capital, SFN, 6 Rivers Systems, amd Hardware
- Income Statement, Balance Sheet and Cash Flow, with both GAAP and Non-GAAP quarterly figures
- Discounted Cash Flow (DCF) up until 2060. A 9.1% Weighted Average Required Rate of Return (WACC for practical purposes), 7% Revenue CAGR until 2060, 18% EBITDA margin by 2060 and a 3% terminal growth rate gets us to a price of US$968 per share
- All figures are adjustable and will impact quarterly and annual forecasts and the DCF.
- We have excluded our SaaS metrics. These are available upon request by subscribers.

